Denver Dragons Salary Strategy
Contract valuations, cap scenarios, and trade limit analysis
Current Cap Status
$135M Hard Limit
$0
$180M
| Net change:
Pre-Built Scenarios
Scenario Changes
Build Custom Scenario
Toggle individual components to model custom cap scenarios
Draft Pick Estimates
Path to Under $135M
What must be shed to get under the hard trading limit
- • Current: $142.75M
- • Target: $135M
- • Must clear: $7.75M
- Options:
- - Trade Jurkin ($27.5M)
- - Renounce holds ($13.65M)
- - Let Biro/Fry walk
Maximize Roster Quality
Best players to retain/add within constraints
- • Available buffer: $3.25M
- • Biro expected: $7.32M
- • Fry expected: $3.95M
- Constraint:
- Cannot re-sign both at market
- without clearing cap space first
Tier 1: Active Decisions
Garrick Jurkin
Big • Age 30
Current:
$27.5M
Expected:
$12.8M
Impact:
57.0
Value Δ:
+$14.7M
CA/PA:
3.5 / 5.0
Years:
1
Domonkos Biro
Wing • Age 23
Current:
$5.2M
Expected:
$7.3M
Impact:
54.0
Value Δ:
-$2.1M
CA/PA:
3.5 / 3.5
Years:
1
Gap Impact Analysis
Kaimyn Fry
Big • Age 22
Current:
$4.9M
Expected:
$4.0M
Impact:
44.0
Value Δ:
+$0.9M
CA/PA:
3.5 / 3.5
Years:
1
Gap Impact Analysis
Team improves in 4/5 key ratings without Fry
Tier 2: Holds to Evaluate
Zach Camara
Guard • Age 30
HOLD
Hold Amount:
$8.0M
Expected:
$11.2M
Impact:
51.0
CA/PA:
3.5 / 3.5
Renouncing removes cap hold
Marquill Edmunds
Wing • Age 32
HOLD
Hold Amount:
$5.65M
Expected:
$0.0M
Impact:
51.0
CA/PA:
2.5 / 2.5
Renouncing removes cap hold
Tier 3: Locked Contracts
| Name | Pos | Age | Salary | Years | Impact | Expected | Value Δ | Tier |
|---|---|---|---|---|---|---|---|---|
| Pedro Santos | Big | 22 | $25.0M | 2 | 64.0 | $17.0M | +$8.0M | Major Overpay |
| Kel Pendergast | Wing | 24 | $19.0M | 2 | 51.0 | $14.8M | +$4.2M | Slight Overpay |
| Brandon Leslie | Big | 29 | $13.5M | 2 | 53.0 | $18.7M | -$5.2M | Fair |
| Hudson Leonard | Wing | 28 | $12.0M | 3 | 53.0 | $23.2M | -$11.2M | Elite Value |
| Tyrae Lewis | Guard | 20 | $6.2M | 3 | 31.0 | $4.4M | +$1.8M | Major Overpay |
| Robert Alcegaire | Big | 28 | $6.0M | 2 | 50.0 | $14.7M | -$8.7M | Elite Value |
| LaMarcus Quinn | Guard | 21 | $4.6M | 2 | 47.0 | $6.7M | -$2.1M | Elite Value |
| Tyrique Beaudean | Guard | 24 | $3.4M | 1 | 46.0 | $0.0M | -$0.0M | N/A |
| Devaugntah Litton | Big | 22 | $1.8M | 2 | 51.0 | $0.0M | -$0.0M | N/A |
Total Salary:
$142.75M
Players:
14
Avg Impact:
50.2
Cap Status:
Over $135M
Denver Dragons Cap Efficiency
Salary Rank
/36
Wins Rank
/36
Efficiency Rank
/36
Cost Per Win
$4.9M
Salary vs Wins (League-Wide)
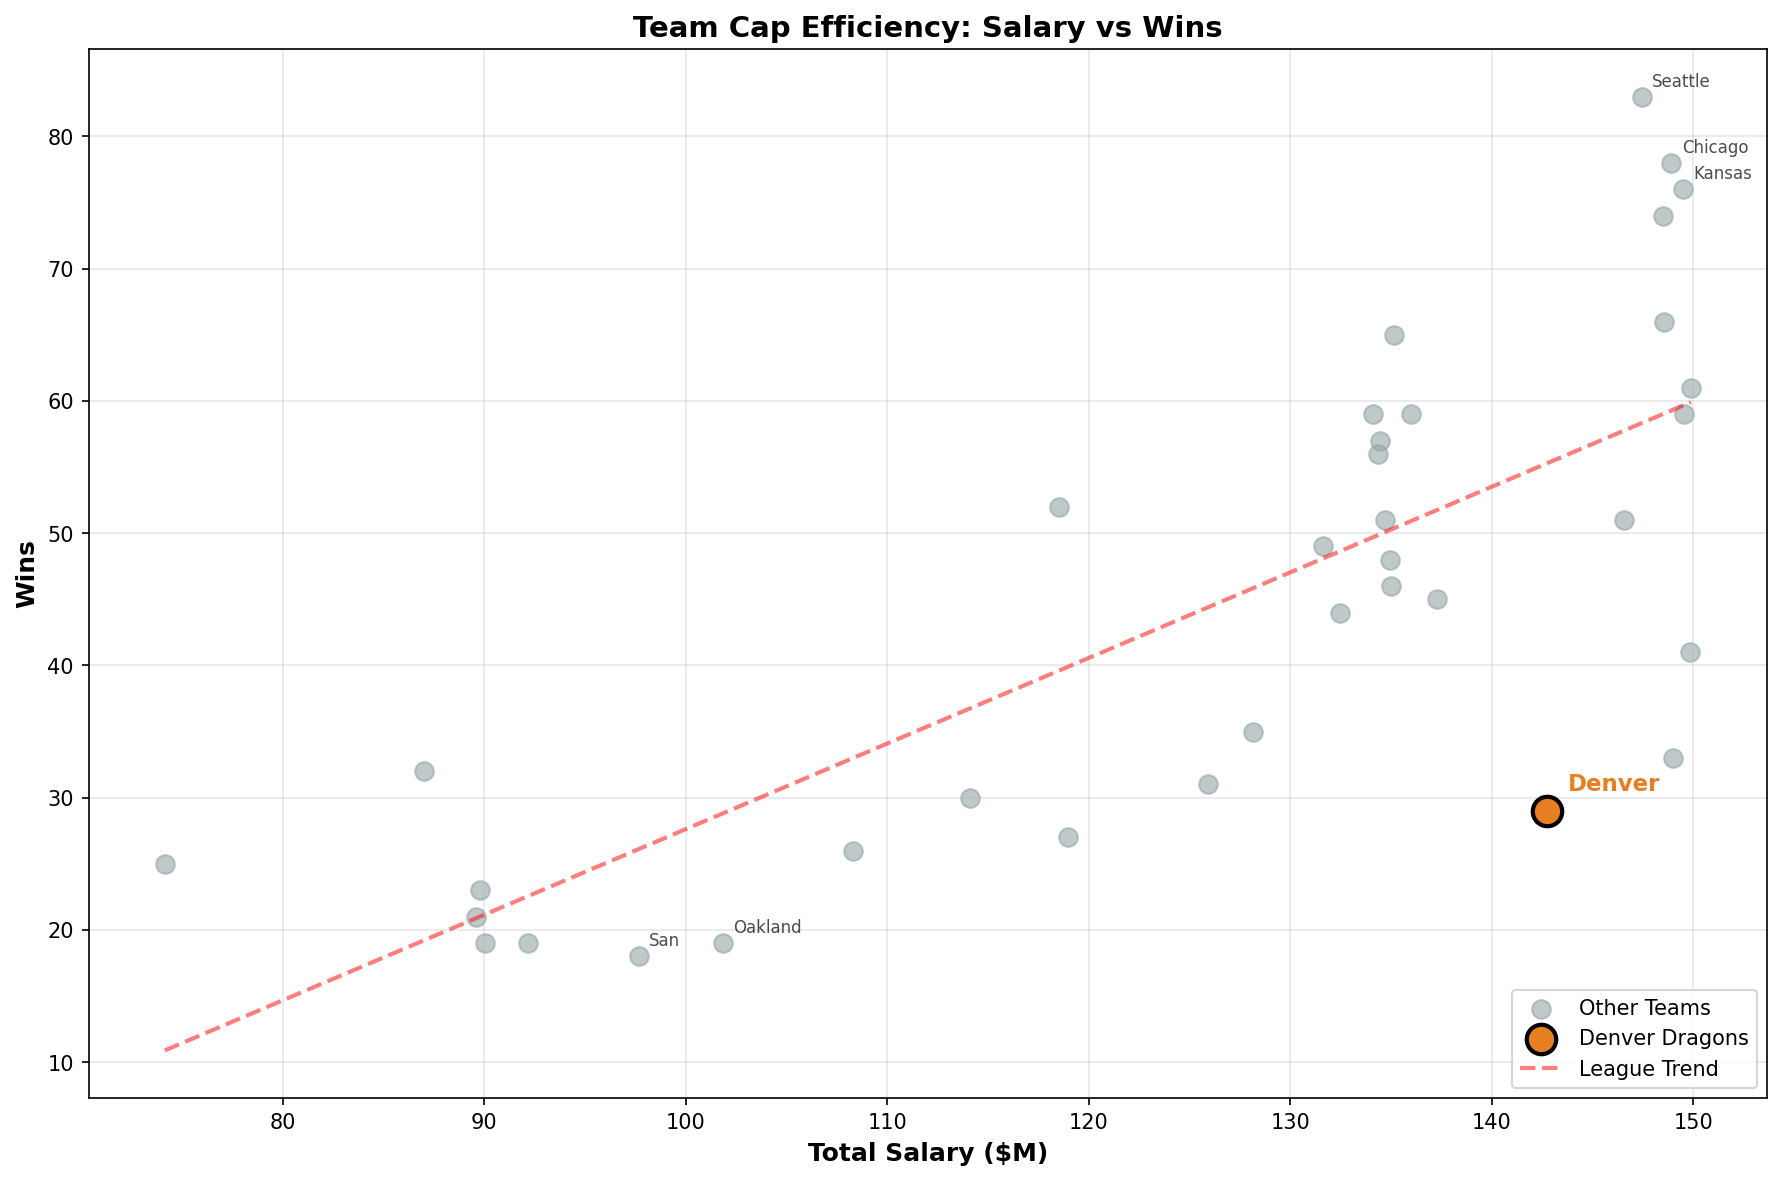
Denver highlighted in orange. Linear trend shows correlation between spending and wins.
League Cap Efficiency Rankings
| Rank | Team | Salary | W-L | Avg Impact | Cost/Win | Cost/Impact |
|---|---|---|---|---|---|---|
| 1 | Seattle Thunder | $147.4M | 83-24 | 58.2 | $1.78M | $2.53M |
| 2 | Chicago Jailbirds | $148.9M | 78-27 | 59.5 | $1.91M | $2.5M |
| 3 | Kansas City Knights | $149.5M | 76-27 | 60.0 | $1.97M | $2.49M |
| 4 | Cincinnati Kings | $148.5M | 74-28 | 59.9 | $2.01M | $2.48M |
| 6 | Vancouver Wolves | $148.6M | 66-30 | 57.8 | $2.25M | $2.57M |
| 5 | Louisville Colonels | $135.1M | 65-32 | 55.9 | $2.08M | $2.42M |
| 12 | Oklahoma City Barons | $149.9M | 61-29 | 56.8 | $2.46M | $2.64M |
| 9 | Cleveland Giants | $136.0M | 59-35 | 56.2 | $2.31M | $2.42M |
| 7 | Las Vegas Scorpions | $134.1M | 59-37 | 53.9 | $2.27M | $2.49M |
| 13 | Portland Lumberjacks | $149.5M | 59-30 | 54.4 | $2.53M | $2.75M |
| 10 | Detroit Mustangs | $134.4M | 57-32 | 54.8 | $2.36M | $2.45M |
| 11 | Philadelphia Warriors | $134.3M | 56-34 | 56.2 | $2.4M | $2.39M |
| 8 | Austin Rockets | $118.5M | 52-38 | 50.4 | $2.28M | $2.35M |
| 14 | Baltimore Bullets | $134.7M | 51-38 | 54.3 | $2.64M | $2.48M |
| 18 | Minneapolis Blizzards | $146.6M | 51-39 | 52.9 | $2.87M | $2.77M |
| 15 | Los Angeles Fireballs | $131.6M | 49-36 | 53.6 | $2.69M | $2.45M |
| 17 | Mexico City Jaguars | $134.9M | 48-35 | 50.4 | $2.81M | $2.68M |
| 19 | Phoenix Vultures | $135.0M | 46-37 | 50.7 | $2.93M | $2.66M |
| 22 | Boston Crusaders | $137.3M | 45-44 | 51.5 | $3.05M | $2.67M |
| 21 | New Orleans Hurricanes | $132.4M | 44-40 | 51.7 | $3.01M | $2.56M |
| 23 | Charlotte Drones | $149.8M | 41-44 | 47.8 | $3.65M | $3.13M |
| 24 | New York Renegades | $128.2M | 35-48 | 47.4 | $3.66M | $2.7M |
| 31 | Miami Cyclones | $149.0M | 33-50 | 49.8 | $4.52M | $2.99M |
| 16 | Dallas Predators | $87.0M | 32-51 | 50.2 | $2.72M | $1.73M |
| 27 | Pittsburgh Vipers | $125.9M | 31-52 | 47.9 | $4.06M | $2.63M |
| 25 | Salt Lake City Saints | $114.1M | 30-53 | 50.4 | $3.8M | $2.26M |
| 34 | Denver Dragons | $142.8M | 29-53 | 50.2 | $4.92M | $2.84M |
| 30 | Washington Pilots | $119.0M | 27-56 | 46.8 | $4.41M | $2.54M |
| 28 | Houston Lightning | $108.3M | 26-57 | 45.5 | $4.17M | $2.38M |
| 20 | Toronto Huskies | $74.2M | 25-58 | 45.0 | $2.97M | $1.65M |
| 26 | Atlanta Devils | $89.8M | 23-60 | 45.2 | $3.9M | $1.99M |
| 29 | Indiana Stonecutters | $89.6M | 21-62 | 46.4 | $4.27M | $1.93M |
| 33 | Nashville Stars | $92.2M | 19-64 | 42.4 | $4.85M | $2.18M |
| 35 | Oakland Tritons | $101.8M | 19-64 | 45.3 | $5.36M | $2.25M |
| 32 | St Louis Skyhawks | $90.0M | 19-64 | 42.4 | $4.74M | $2.12M |
| 36 | San Diego Calaveras | $97.7M | 18-65 | 42.9 | $5.43M | $2.28M |
League-Wide Contract Values
All qualified players (20+ games, 10+ MPG) with value tier analysis
Showing of 379 players
| Name | Team | Pos | Age | Salary | Expected | Value Δ ↕ | Tier | Impact |
|---|---|---|---|---|---|---|---|---|
Page of