Draft Pick Development Analysis
Value curve, hit rates, and development patterns across 516 drafted players (2049 season)
Denver Pick #10 (8-12 range)
Denver Pick #72 (66-72 range)
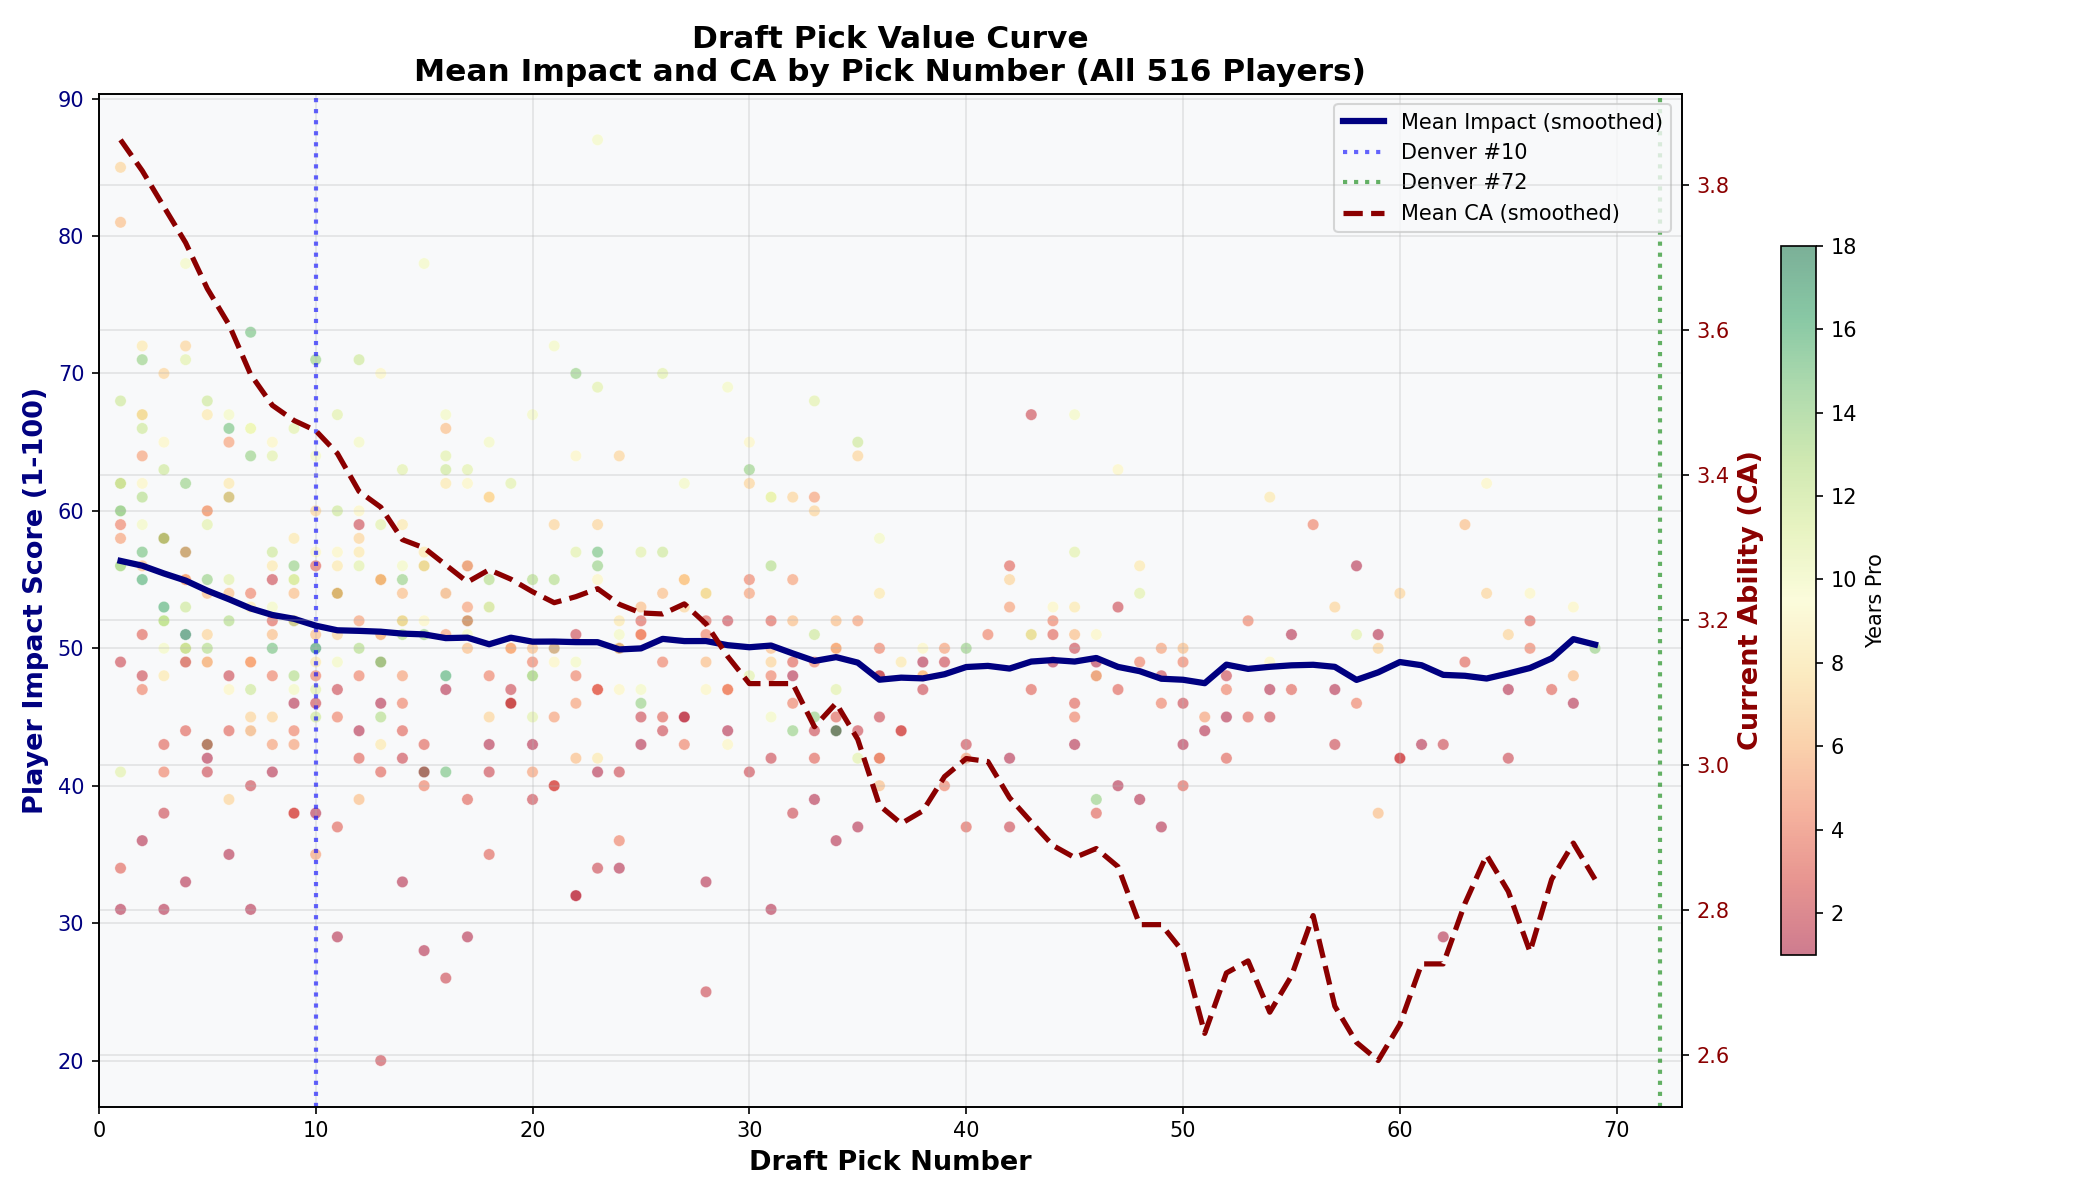
Pick Value Curve
Expected CA and Impact Score by draft position. Denver's picks (#10, #72) marked with vertical lines.
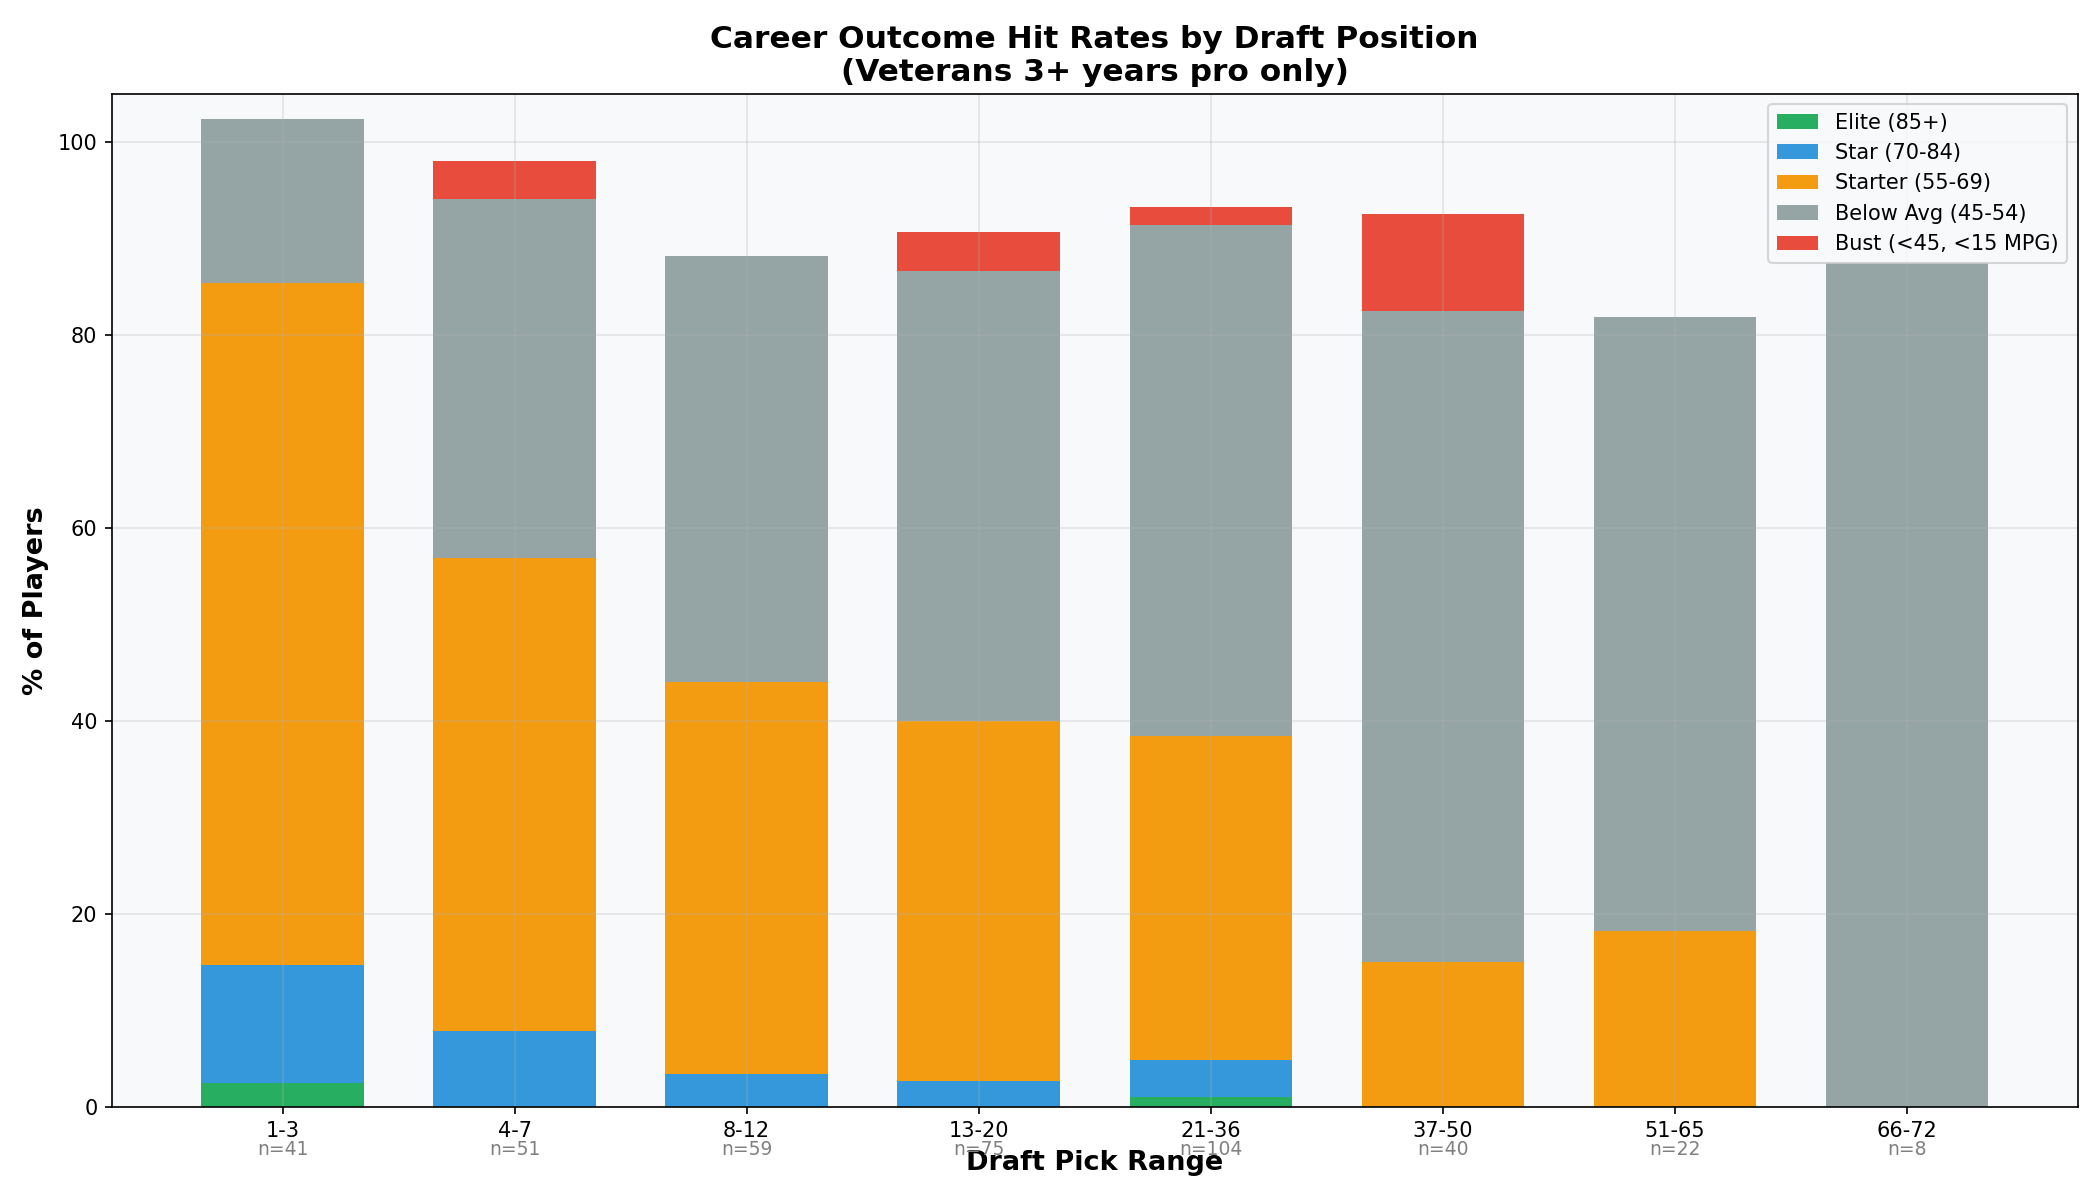
Hit Rates by Pick Range
Percentage of players reaching each tier (Elite 85+, Star 70-84, Starter 55-69, Below Avg 45-54, Bust <45)
| Pick Range | N | Avg Impact | Avg CA | Elite % | Star % | Starter % | Bust % |
|---|---|---|---|---|---|---|---|
| 1-3 | 47 | 56.1 | 3.71 | 2.4% | 12.2% | 70.7% | 0.0% |
| 4-7 | 59 | 53.5 | 3.58 | 0.0% | 7.8% | 49.0% | 3.9% |
| 8-12 ★ | 69 | 51.6 | 3.39 | 0.0% | 3.4% | 40.7% | 0.0% |
| 13-20 | 91 | 50.4 | 3.27 | 0.0% | 2.7% | 37.3% | 4.0% |
| 21-36 | 135 | 50.0 | 3.14 | 1.0% | 3.8% | 33.7% | 1.9% |
| 37-50 | 61 | 48.3 | 2.87 | 0.0% | 0.0% | 15.0% | 10.0% |
| 51-65 | 38 | 48.1 | 2.74 | 0.0% | 0.0% | 18.2% | 0.0% |
| 66-72 ★ | 12 | 50.0 | 2.88 | 0.0% | 0.0% | 0.0% | 0.0% |
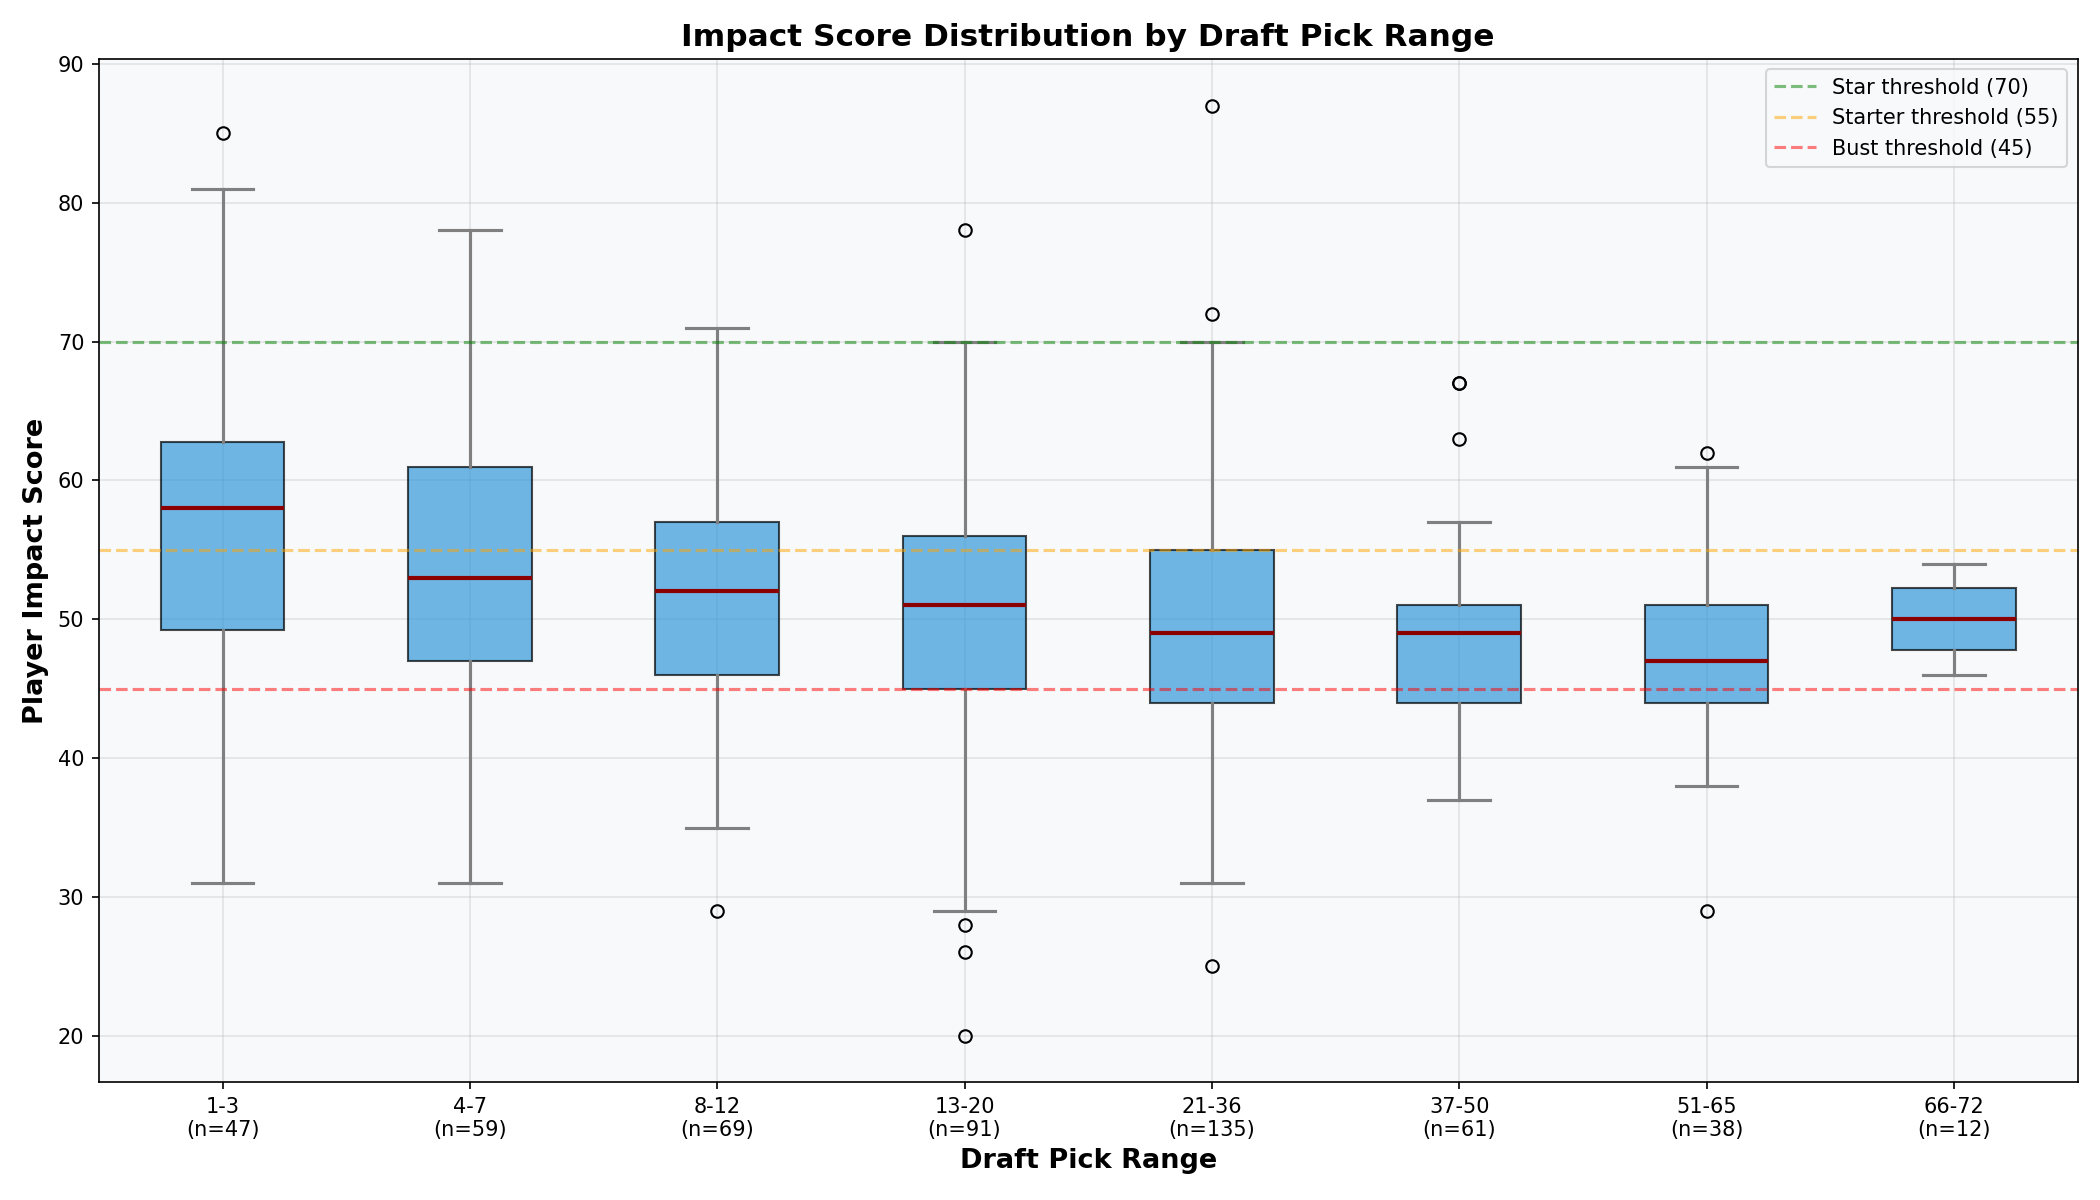
Impact Distribution by Pick Range
Box plots showing median, quartiles, and outliers. Horizontal lines mark tier thresholds (Star 70, Starter 55, Bust 45).
Outcome Tier Distribution
Stacked bar chart showing percentage breakdown by tier. Sample sizes shown on bars.
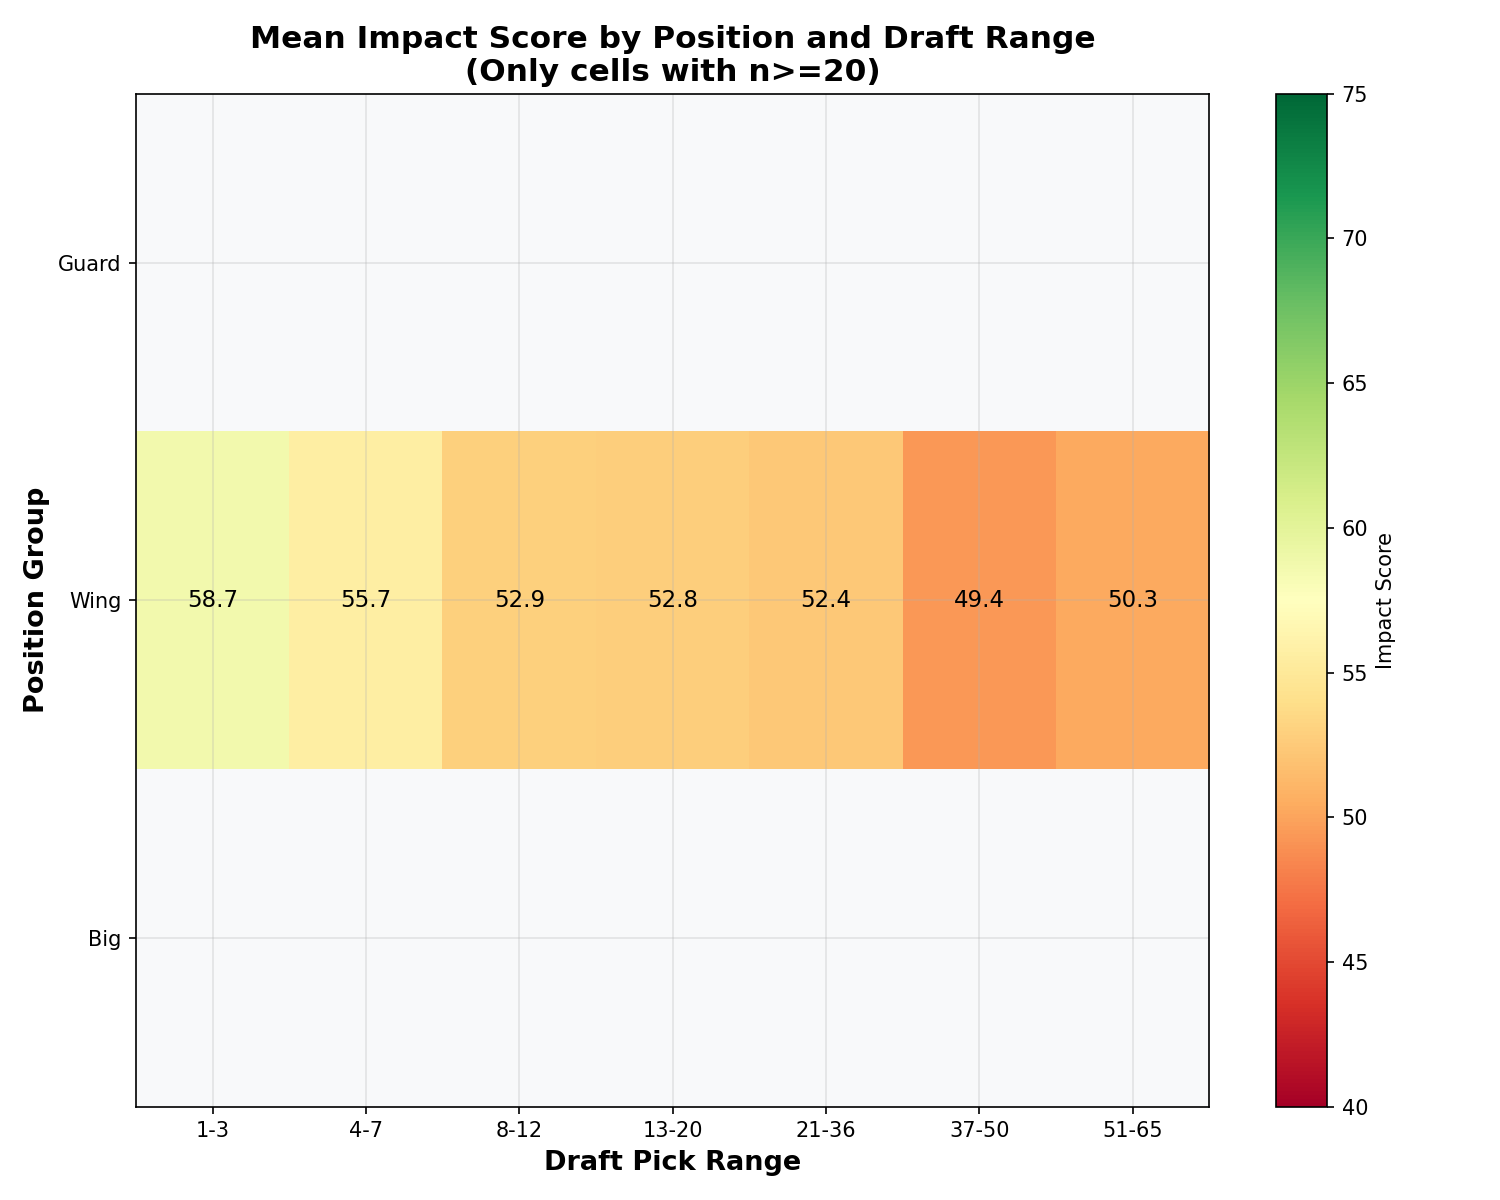
Positional Breakdown
Mean Impact Score by position and pick range. Only cells with n≥20 shown due to high positional variance.
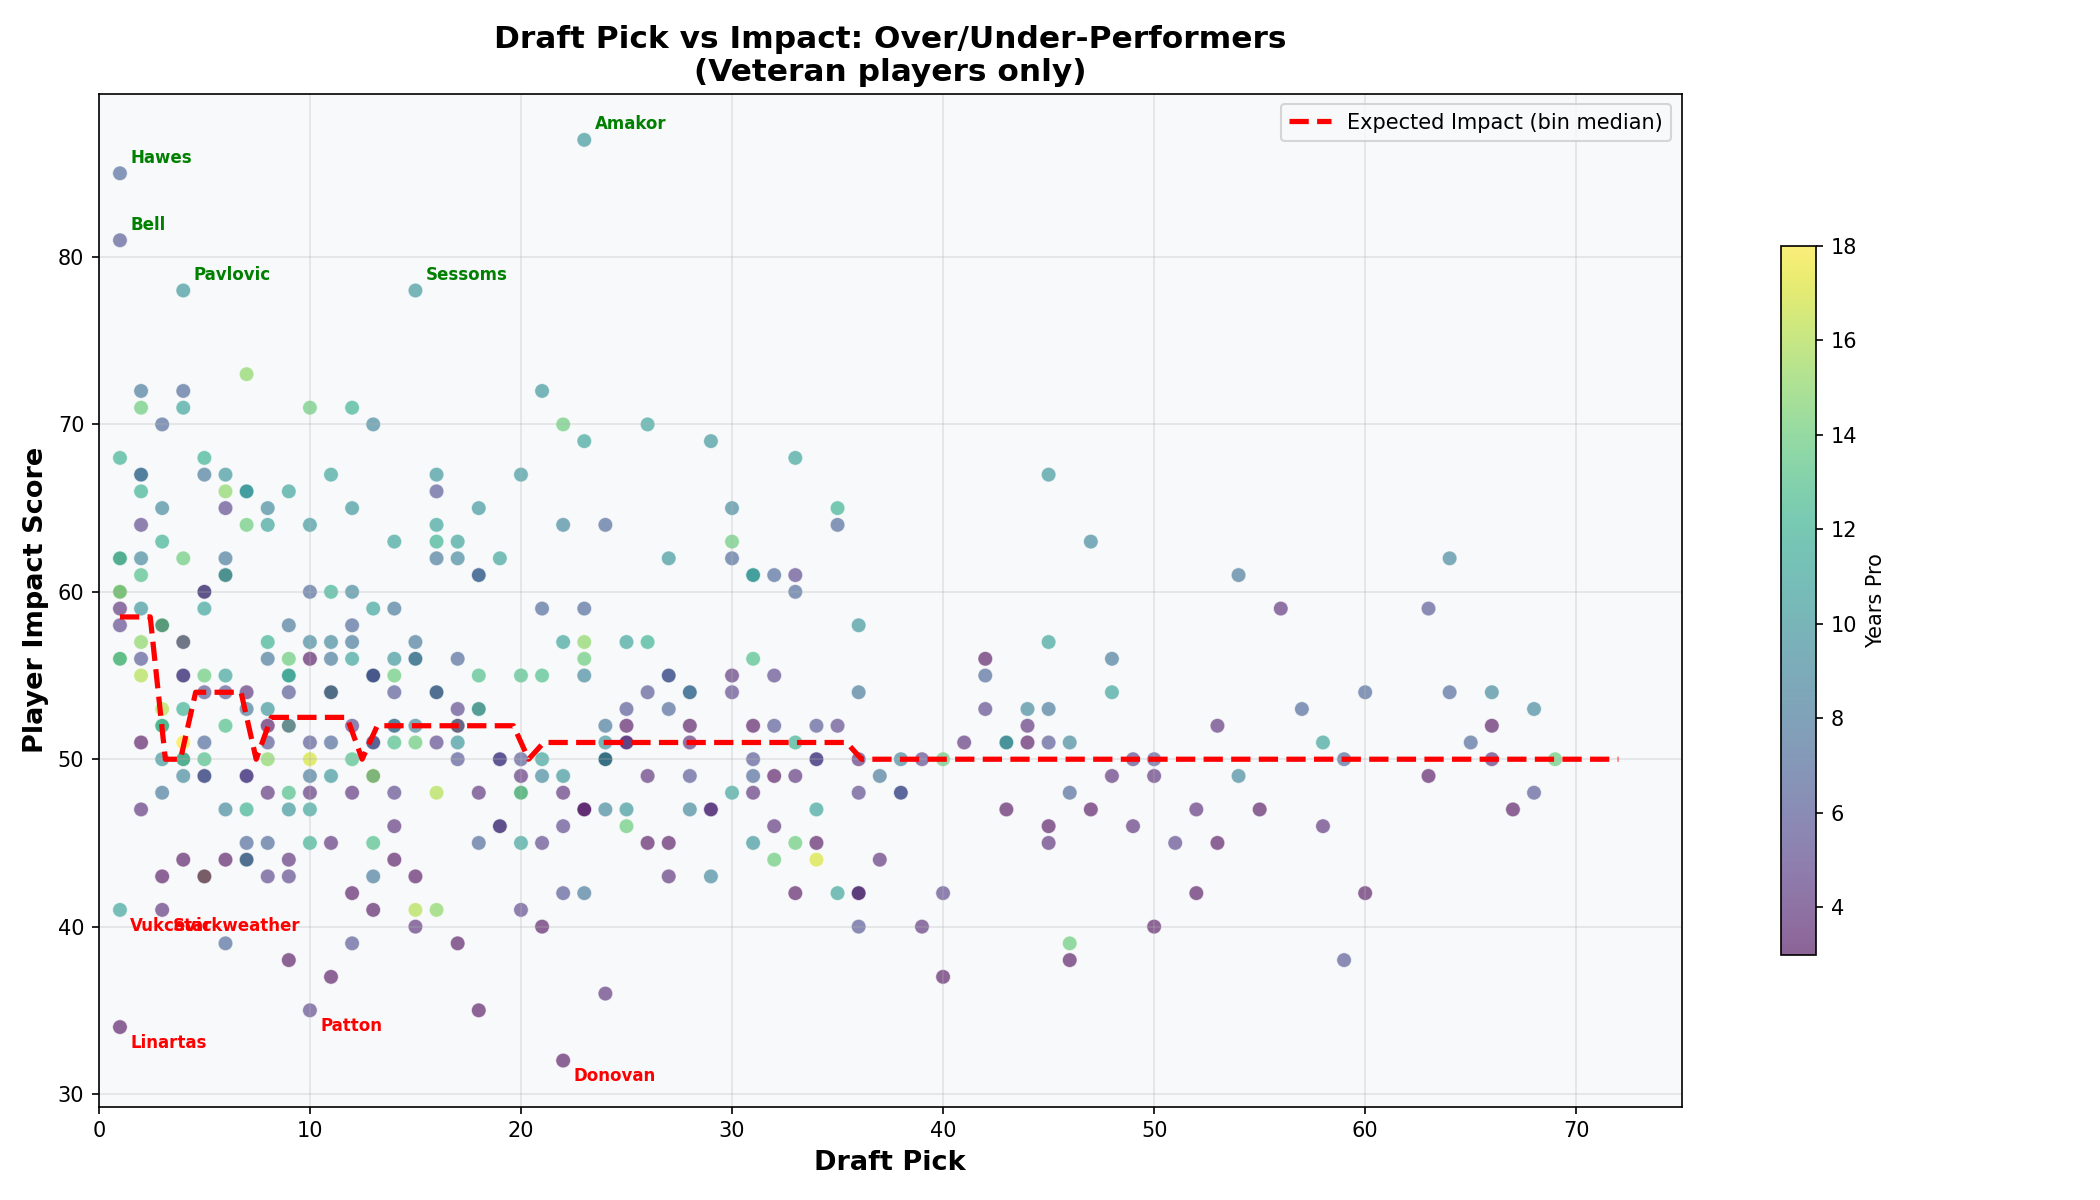
Over/Under-Performers
Impact residuals from bin-median expectation. Top 10 overperformers (green) and underperformers (red).
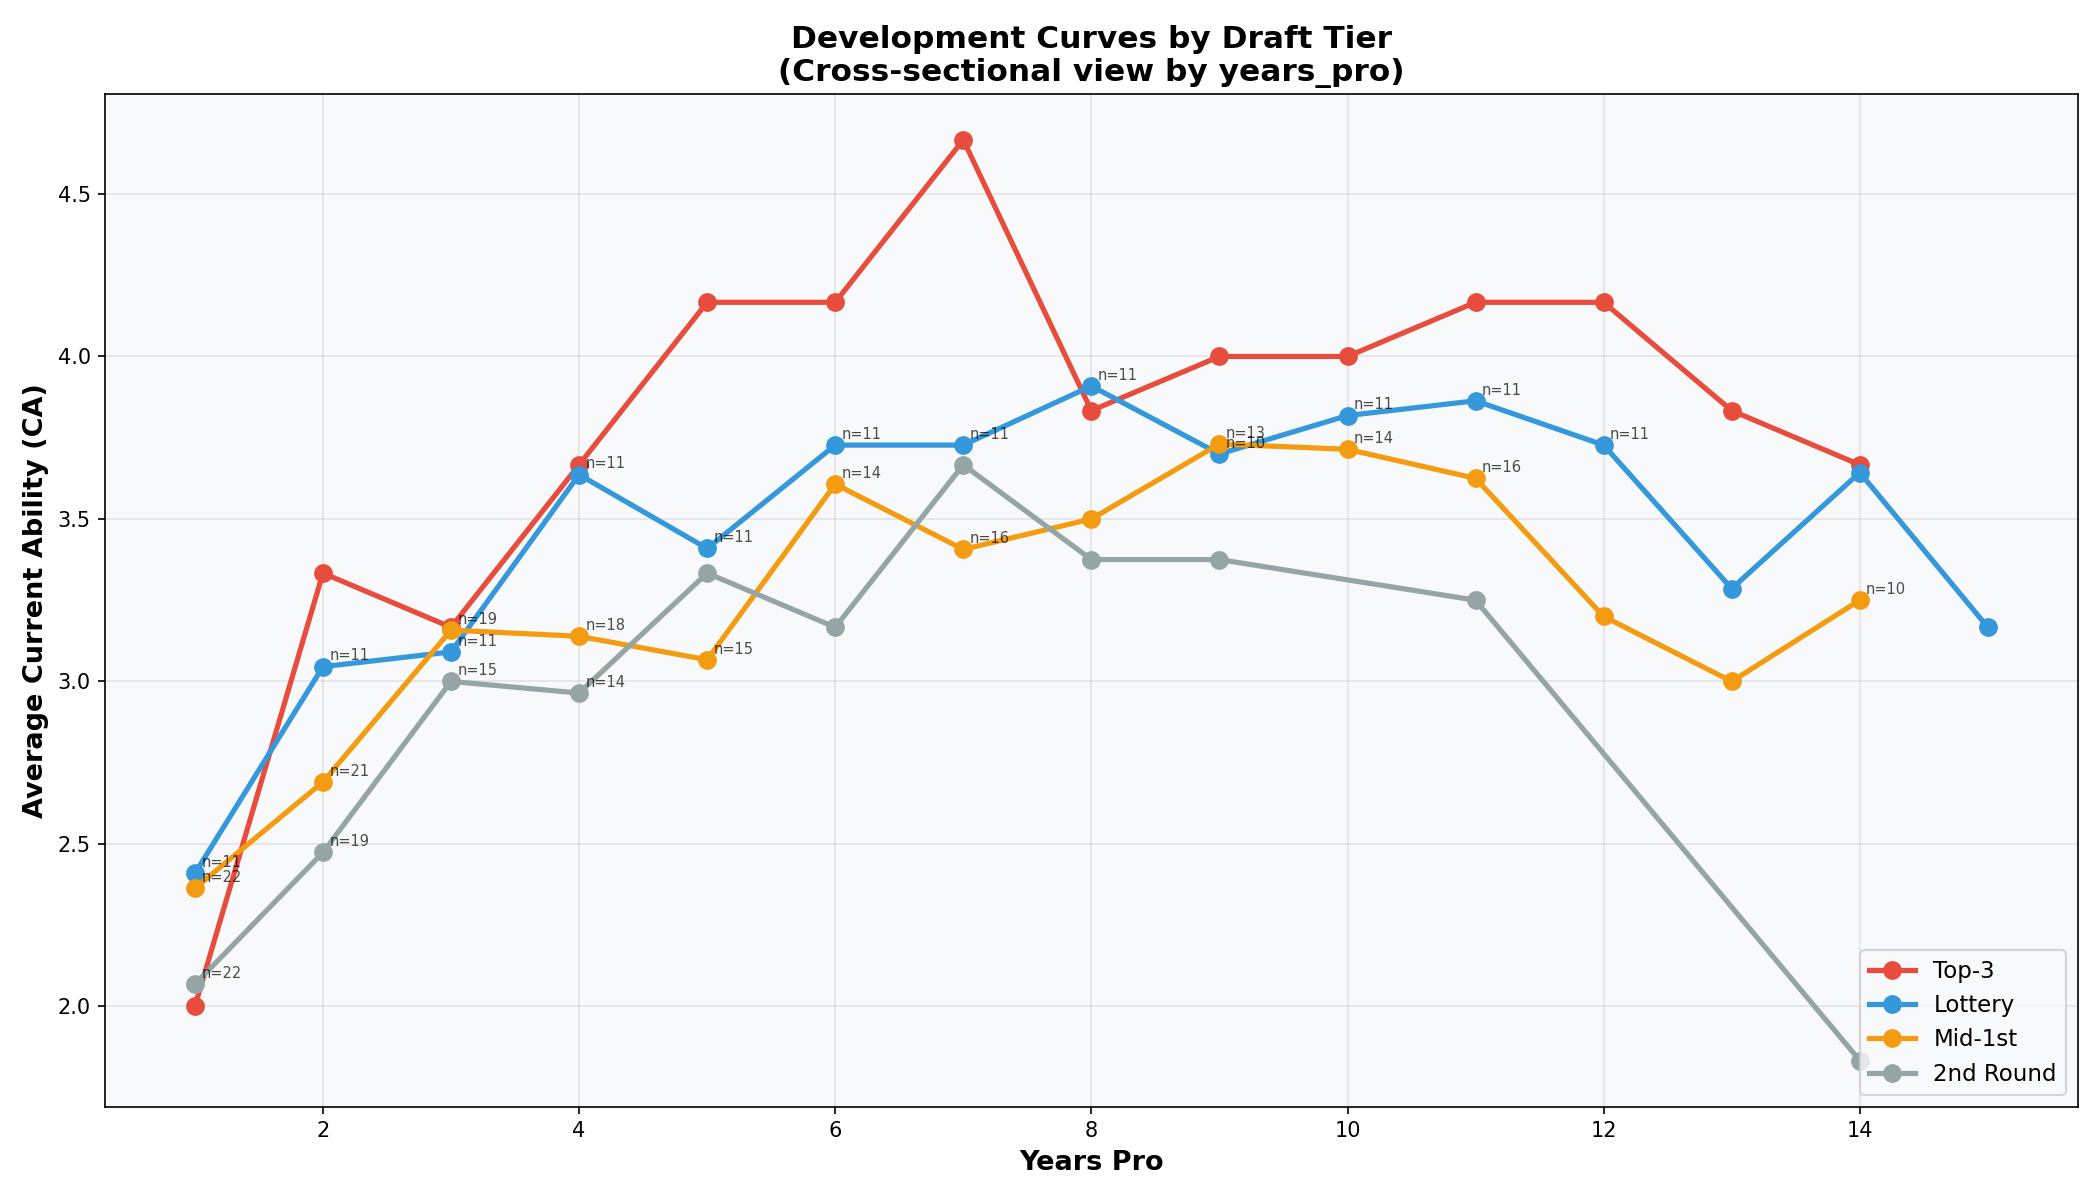
Development Curves by Pick Tier
Mean CA by years in the league for 4 pick tiers. Cross-sectional view with survivorship bias caveat — sample sizes drop as players leave the league.
Draft Class Strength
Average CA and Impact by draft season. Recent classes appear weaker due to limited development time.